Data visualisation: Basic design and data analysis principles
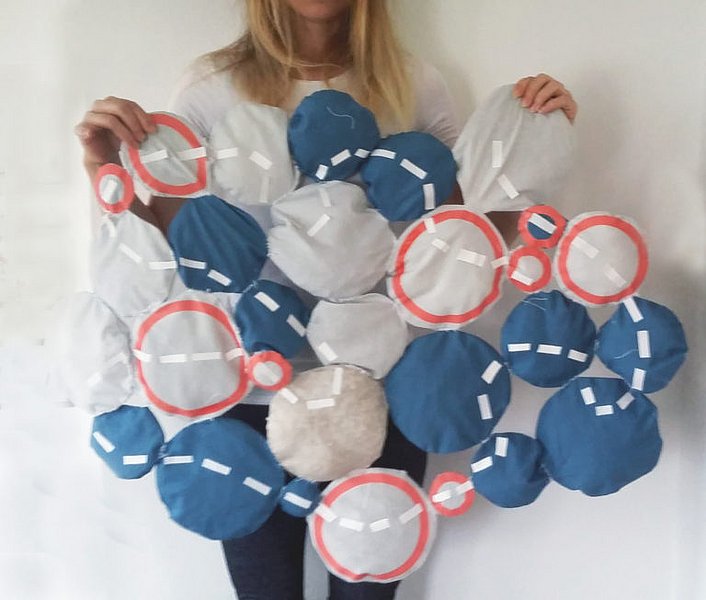
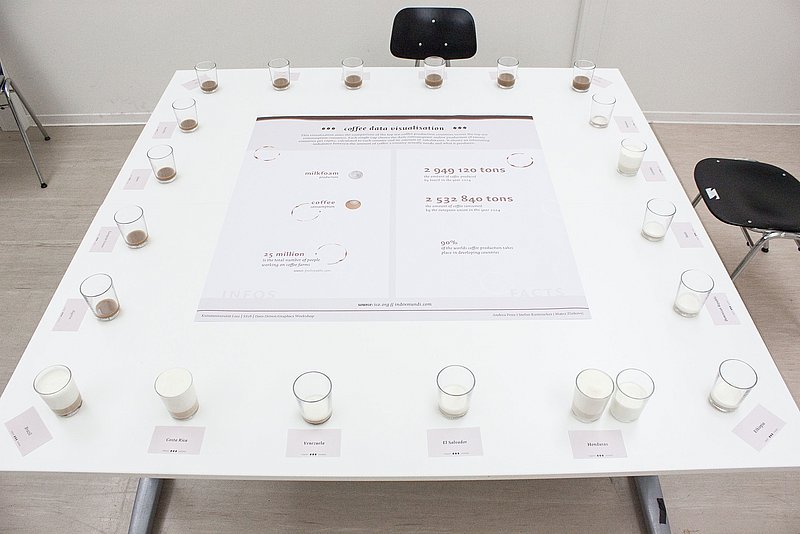
This workshop focuses on teaching the the core principles and processes of data visualisation: instead of teaching tools, we are teaching principles that can be applied across technologies and media. Students will learn the basics of how to gather, structure and analyse a dataset and also learn the process of data visualisation from sketch to finished piece. Through the course, students will analyse and visualise a dataset of their own choosing using the medium of their choice: this outcome will be led by one’s interests and study and can take the form of anything from a website or 2D graphic to a physical object or sound piece, though all outputs need to be documented online in the way you feel will best communicate your project to a wider, web-based audience.
Course Lecturers
Stefanie Posavec is a designer for whom data is her favoured material, with projects ranging from data visualisation and information design to commissioned data art. Her personal work focuses on non-traditional representations of data derived from language, literature, or scientific topics, often using a hand-crafted approach. This work has been exhibited internationally at major galleries including MoMA (New York), CCBB (Rio de Janeiro), the Science Gallery (Dublin), the V&A, the Design Museum, the Science Museum, The Southbank Centre, and Somerset House (London). In 2013 she was Facebook's first data-artist-in-residence at their Menlo Park campus. She recently completed a year-long drawing project with Giorgia Lupi (based in NYC) called Dear Data, where each week they gathered and drew their data on a postcard to send to the other. This project was deemed the ‘Best Dataviz Project’ and the ‘Most Beautiful’ (the highest accolade) at the 2015 Kantar Information is Beautiful Awards, nominated for the London Design Museum’s illustrious ‘Designs of the Year 2016’ exhibition, and a book of this project is published by Particular Books (Penguin Random House UK) and Princeton Architectural Press (USA). The 104 postcards and sketchbooks that form the project are held in the permanent collection of MoMA, New York. @stefpos
www.stefanieposavec.co.uk www.dear-data.com
Miriam Quick is a data journalist and researcher specialising in data visualisation and information design. Focusing on the conceptual and data-driven parts of the creative process, she collaborates with artists, designers and developers to produce infographics, interactive pieces, animations and installations. Her work regularly features on bbc.com, Quartz (qz.com) and informationisbeautiful.net and she acted as lead researcher on David McCandless’s book ‘Knowledge is Beautiful’. She often works with Stefanie Posavec as part of a researcher-designer team and together they have produced pieces for numerous clients including London's Southbank Centre and the Italian arts supplement La Lettura. Her most recent project is Oddityviz, created jointly with designer Valentina D’Efilippo, which visualises musical data from David Bowie’s song Space Oddity on a series of engraved 12-inch records. The records were displayed in Wieden+Kennedy London’s window space in January 2017.
www.miriamquick.com @miriamquick www.oddityviz.com